 BTC
BTCA record behind
the reasoning.
Forecast receipts, paper decision replay, market memory, and downloadable research packets make previous observations easier to inspect.
Explore the research tools ↗NOVI AI is an AI cryptocurrency analytics platform designed for XRP and other digital assets. Explore technical indicators, market sentiment, whale activity, support and resistance levels, and AI-generated forecasts.

Inside NOVI AI
The current NOVI dashboard, on desktop and phone. These are captured views from September 7, 2026; open NOVI for current data and service status.
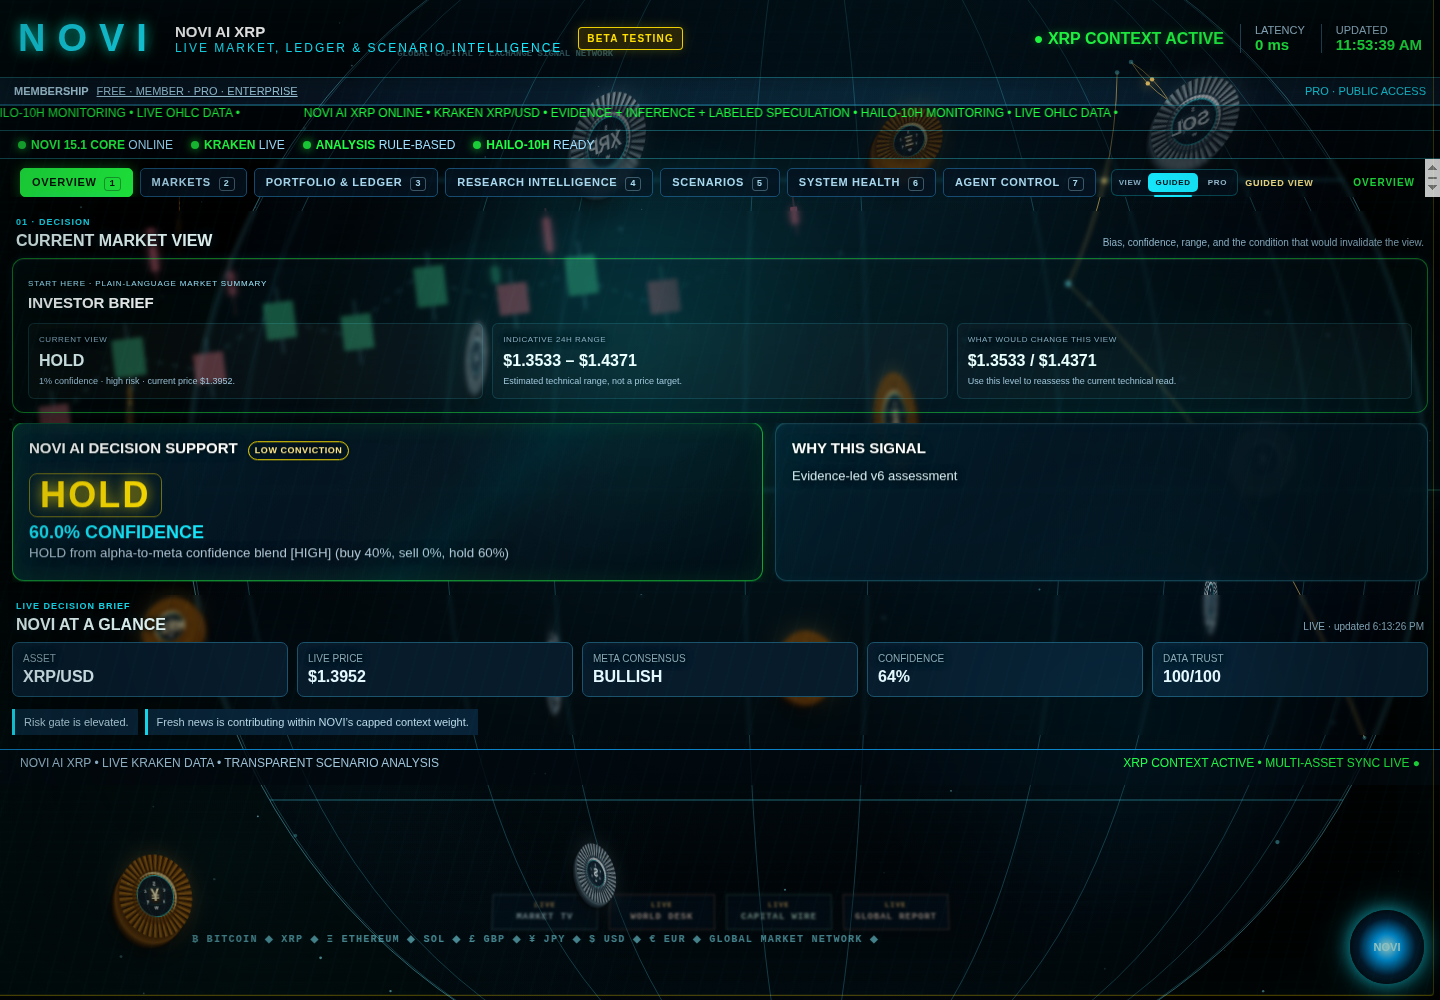
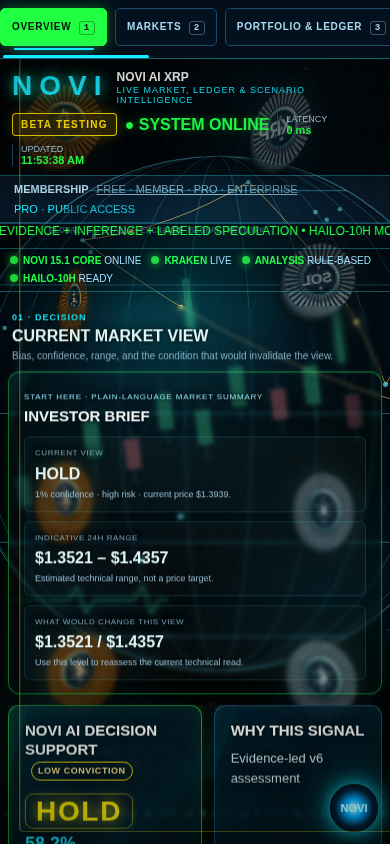
A closer look at what’s new
The dashboard now connects deeper market visuals, a record of its reasoning, and a dedicated space for testing assumptions.
Forecast receipts, paper decision replay, market memory, and downloadable research packets make previous observations easier to inspect.
Explore the research tools ↗Scenario Studio, a market digital twin, counterfactual tests, liquidity views, and a stress matrix bring assumptions into view.
Explore the scenario tools ↗A 49-agent matrix, contribution waterfall, calibration curve, trust breakdown, and model-drift radar make oversight visible.
Meet the agent network ↗Your command center
Move from an overview to the supporting research, then check scenarios and system health. The same workspaces travel with you from desktop to phone.
INSIDE THE DASHBOARD
Start with the market brief, key observations, and the evidence behind the current view.
Read the current market view, indicative range, risk context, and conditions that could change the assessment.
Inspect the analysis basis, supporting evidence, confidence, and validation context behind the displayed view.
Follow recorded signal changes and the observations that need attention.
See the selected asset, current price, Meta consensus, data-trust score, and research alerts together.
Expanded desktop viewChoose the level of dashboard detail that suits the way you research.
Move between seven workspaces, use number-key shortcuts on desktop, and return to the last workspace you opened.
INSIDE THE DASHBOARD
Explore market data, forecast context, liquidity, and activity across supported assets.
Explore supported crypto, equity, and ETF markets with source availability and provider context.
Read OHLC candles, momentum, support and resistance, volume, and current regime context.
Inspect scenario bands and forecast horizons alongside their assumptions.
Expanded desktop viewExplore public bid/ask depth, order-book imbalance, and the distribution of available liquidity.
Expanded desktop viewReview observed order-book structure and changes in market depth.
Expanded desktop viewCompare public liquidity with volatility to understand the conditions around a potential move.
Expanded desktop viewInspect correlation and contagion views as comparable market history accumulates.
Expanded desktop viewFollow observed large XRP transfers reported by validated public-ledger feeds.
Expanded desktop viewINSIDE THE DASHBOARD
Follow portfolio context and the paper decision ledger as research develops.
Review portfolio concentration and relationships between supported assets.
Inspect paper drawdown, risk-limit utilization, and the context behind a blocked decision.
Follow research decisions through their recorded lifecycle and outcome review.
Review the recorded view, supporting context, and subsequent paper evidence.
Explore public wallet balances and observed ownership distribution without assuming the identity behind an address.
Trace validated large-transfer flows. Transfer direction does not establish ownership, exchange status, or intent.
Expanded desktop viewINSIDE THE DASHBOARD
Inspect sourced headlines, evidence, and the assumptions behind the analysis.
Read sourced headlines with freshness context and follow through to the original reporting.
Explore the inputs, specialist views, disagreements, and limitations behind a research conclusion.
Step backward and forward through decisions NOVI actually recorded.
Expanded desktop viewInspect timestamped research records and download an evidence packet with receipts, outcomes, and model-risk context.
Expanded desktop viewCompare the current setup with recorded historical patterns. Similarity provides context, not a promised outcome.
Expanded desktop viewSee when eligible news context and market-data consensus point in different directions.
Expanded desktop viewInspect a composite research score alongside data trust, agent agreement, volatility, and confidence.
Expanded desktop viewCompare the positions and confidence reported by the specialist committee.
Expanded desktop viewReview agent outcome lanes with resolved and pending paper samples visible.
Expanded desktop viewFollow the consensus ribbon, regime history, and calibration curve as recorded observations accumulate.
Expanded desktop viewReview prospective forecast scoring, news-to-price context, and confidence decomposition with source coverage visible.
Expanded desktop viewINSIDE THE DASHBOARD
Compare possible paths, catalysts, and conditions that would change the thesis.
Compare possible market directions with ranges, horizons, and explicit invalidation conditions.
Bring live-volatility scenarios and sensitivity tests into a dedicated paper-research workspace.
Expanded desktop viewInspect defensive, base, and expansion paths derived from observed volatility and current consensus.
Expanded desktop viewExplore changes such as a liquidity shock, higher volatility, or removing a specialist contribution.
Expanded desktop viewCompare paper-risk assumptions across different market stress conditions.
Expanded desktop viewFollow prospective transitions between recorded market regimes as history grows.
Expanded desktop viewINSIDE THE DASHBOARD
Check feed freshness, service availability, and operational verification.
Check which market feeds, ledger connections, and services are available in the current deployment.
Inspect source state, timestamps, latency, and available provider fallback across supported asset classes.
Monitor read-only processor load, memory, storage, temperature, and connectivity information.
Review background-cycle health, recent successful observations, and operational delays.
Distinguish live, delayed, degraded, unavailable, and retired services in their reporting context.
INSIDE THE DASHBOARD
Inspect the governed agent network, responsibilities, and current reporting state.
Inspect responsibilities, rolling task activity, and provisional ratings while scored evidence develops.
Compare predicted confidence with observed paper outcomes and visible sample counts.
Understand why the system considers a view live, cautious, or withheld.
Follow the verified observations associated with a change in the displayed assessment.
Inspect cross-asset relationships and liquidity-versus-volatility context as evidence becomes available.
Explore specialist contributions, signal attribution, and committee agreement before Meta governance.
Expanded desktop viewInspect model-risk context, receipt history, validation proposals, and available rollback information.
Expanded desktop viewCore workspaces are available on phone and desktop. Expanded visualizations are marked for desktop; historical and calibration views develop as observations accumulate.
Behind the dashboard
The research pipeline now includes a TimesFM challenger, forecast memory, and reliability scoring. Their role is to build a record for evaluation.
How NOVI evaluates change ↓Independent forecasts are logged for prospective paper evaluation. TimesFM does not change the current NOVI consensus, risk controls, or execution.
Preserves forecasts with their inputs, horizons, and later observed outcomes so calibration can be checked against a recorded history.
Training depends on sufficient resolved paper observations. Diagnostic weights remain hypothetical; model promotion requires validation and owner review.
Market frontline
Use NOVI AI to watch the forces behind a move: momentum, liquidity, conviction, and the evidence that could reverse the advance.

Beyond the dashboard
Traditional dashboards place charts beside one another and leave interpretation to the viewer. NOVI AI operates as a coordinated intelligence system. Every conclusion carries evidence, confidence, dissent, assumptions, and conditions that would invalidate it.
Specialist agents evaluate the same market through distinct lenses, reducing dependence on any single model, source, timeframe, or indicator.
A dedicated challenger attacks the leading thesis, searches for contradictory evidence, and constructs the strongest opposing interpretation.
NOVI AI estimates how much to trust itself using source agreement, freshness, regime familiarity, prior error, and unresolved agent conflict.
Base, bullish, and bearish paths are expressed as ranges with time horizons, probabilities, catalyst assumptions, and explicit invalidation levels.
How we differentiate ourselves
NOVI AI is designed to go beyond conventional commercial dashboards by making the reasoning visible: evidence is sourced, uncertainty is named, the leading view is challenged, and forecasts are scored after the fact.
Claims retain provenance, freshness, limitations, and counter-evidence so users can inspect why a view exists.
Forecast confidence is measured against realized outcomes instead of being treated as a permanent model promise.
Specialist and challenger perspectives are retained rather than flattened into a single unexplained signal.
Data freshness, host pressure, service health, incidents, and allowlisted recovery are monitored separately from analysis.
Visualize charts, metrics, alerts, or portfolio performance for the user to interpret.
Coordinate evidence into a challenged, confidence-rated intelligence brief.
User-selected indicators, screens, and individual analytical tools.
A governed network of 49 agents supports market research, evidence, challenge, evaluation, and operational reliability.
Conflicting signals are generally reconciled by the viewer.
A dedicated Challenger agent builds the strongest opposing case and records unresolved dissent.
May show scores or signals without explaining when the system itself is less reliable.
Confidence reflects source freshness, agent agreement, regime familiarity, prior error, and data health.
Charts and targets often imply a single expected direction.
Bull, base, and bear paths use probability ranges, horizons, catalyst assumptions, and explicit invalidation conditions.
Product logic changes through vendor releases or manual user configuration.
Forecasts are preserved, scored against outcomes, and used to propose governed, testable, reversible improvements.
The user may need to notice stale data, missing feeds, or service disruption.
Health monitors detect failures; approved runbooks can retry, fail over, restart, or restore a last-known-good version.
The visible result may be separated from the reasoning that produced it.
Every conclusion retains evidence, assumptions, dissent, confidence, and conditions that would make it wrong.
NOVI AI is an XRP-focused research and decision-support architecture. It is not represented as universally superior to every commercial product; its differentiation is the combination of visible evidence, challenge, calibration, and bounded operations. Projections are probabilistic, not guarantees, and controlled autonomy does not mean unsupervised trading or unrestricted self-modification.
Coordinated intelligence
Eight core functions organize the research process below. Open Agent Control in NOVI to inspect individual responsibilities and current agent status.
Evidence synthesis
Continuous improvement
NOVI AI preserves every forecast with its evidence and assumptions, then measures the result. Improvement is earned through evaluation—not asserted by the model.
SELF-ESTIMATION
PROJECTION ENGINE
CONTROLLED SELF-REPAIR
GOVERNED EVOLUTION
NOVI AI beta program
NOVI AI is actively evolving through measured releases. The current beta combines live market context, validated-ledger telemetry, evidence-bound reasoning, forecast calibration, and operational health controls in one explainable command system.
Pro access is included during the active beta. Explore the dashboard today. Features, data coverage, and availability continue to evolve as the system is evaluated.
Explore free Pro beta →Every live claim carries provenance, freshness, limitations, and counter-evidence—not a black-box score.
Scenarios retain confidence, evidence, invalidation conditions, and later outcome scoring for calibration.
NOVI distinguishes trend, range, event-risk, transition, and degraded-data conditions before emphasizing a view.
Bounded self-healing monitors data freshness, services, resources, incidents, and safe recovery policy.
NOVI access
Basic, Researcher, and Pro use the same NOVI command center. Lower-tier workspaces remain visible but protected; no research is deleted when a member upgrades. Pro is included free for the active beta.
$19 monthly · $190 yearly
For focused market monitoring and cross-asset intelligence.
$59 monthly · $590 yearly
For active investors who need risk context and a deeper research workflow.
$0 beta · $129 monthly after beta
Full generative NOVI intelligence for accountable market research.
Contact Skyfall Legacy
For product questions, beta access, account support, billing, or legal matters, contact the appropriate NOVI team below.